Step-by-Step Web Application Performance Testing and Tuning
Posted 2008-03-06 in Programming by Johann.
1. Document current performance
- Test the entire system. I test the performance of blojsom (blog software) running in Orion (application server) proxied by lighttpd.
- Test only the parts that can be made faster. I use lighttpd for static files so I would never include static files when optimizing Servlet/JSP performance.
- Never touch libraries. Third-party or open-source libraries can be performance bottlenecks. Patching libraries – especially if you do not have the source code – can become a maintainance nightmare. Look for replacements and newer versions where possible.
- Test the real thing. Most of the time, this will be a dream though. My 2.4 GHz Xeon desktop machine does 0.7 requests/s while my HostEurope VPS manages over 2.5 requests/s. Hey, it’s just a virtual server so it must be slower, right? Wrong.
- Test with the production operating system. Certain operations are expensive under Windows and cheap somewhere else and vice versa.
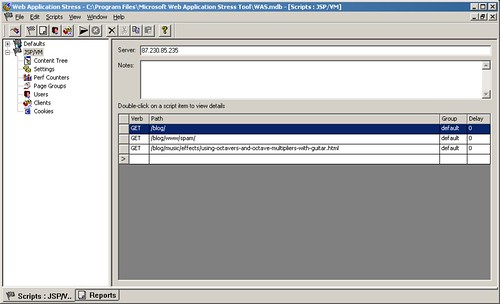
I use Microsoft’s WAST to test performance. The Microsoft Web Application Stress Tool is ages old, but I like it for several reasons:
- Control over request headers.
- Creates obscene amounts of requests (several 1000/s).
- Free with a good GUI.
2. RAM is cheap
A lot of software packages offer in-memory caching. Use it! Keep in mind you might be changing factors like
- Speed of garbage creation. By caching, you can change the memory allocation behaviour of an application. Applications that dominantly generate new objects (per-request) will suddenly keep objects for much longer.
- Garbage collection speed. If you keep more objects in RAM, your memory usage will grow which will lead to more frequent garbage collections (if you do not increase the memory allocation) and longer running garbage collections (if you do). Enable garbage collection logging and use GCViewer to check how much time is spent in garbage collection. 95+ % is very good, 75 % is not good I would say.
Like everything else, caches have bugs. RAM file systems exist.
In my case, using caches increased the performance from 0.7 requests/s to 5.4 requests/s.
3. Profile
Profilers will tell you how much time is spent where. They come in all varieties but, in the end, they all do the same thing.
- Profile as many classes as possible. If 90 % of the CPU time is spent in system classes but you don’t profile these, you will optimize the application classes – where only 10 % is spent.
- Don’t profile classes you cannot change. Exclude the class hierarchy of your application server.
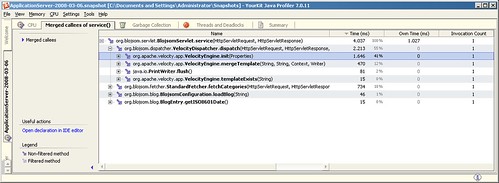
In this example, you can see that most of the CPU time is spent in the VelocityEngine#init method. Looking into the code, I discovered that a new VelocityEngine was generated for each request. Oops.
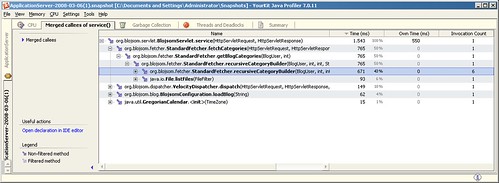
After caching the VelocityEngine, the Velocity page creation takes 10 % CPU time instead of 55 % and the performance is 7.7 requests/s instead of 5.3 requests/s. But – we have a new performance hot spot in the StandardFetcher class.
As you see, each performance optimization step shifts the bottleneck to a new place.
4. Stop
In an ideal world, web pages would come preinstalled on the visitor’s computer. In the end, nobody can tell the difference between a latency of 70 ms and 100 ms on the web.
Does it make sense to repeat these performance tuning steps? Yes, if you cannot improve performance by other means (and most of the time, you can) and if the performance is seriously bad (in that case, changing software might also be an option).
Subscribe
RSS 2.0, Atom or subscribe by Email.
Top Posts
- DynaCloud - a dynamic JavaScript tag/keyword cloud with jQuery
- 6 fast jQuery Tips: More basic Snippets
- xslt.js version 3.2 released
- xslt.js version 3.0 released XML XSLT now with jQuery plugin
- Forum Scanners - prevent forum abuse
- Automate JavaScript compression with YUI Compressor and /packer/


